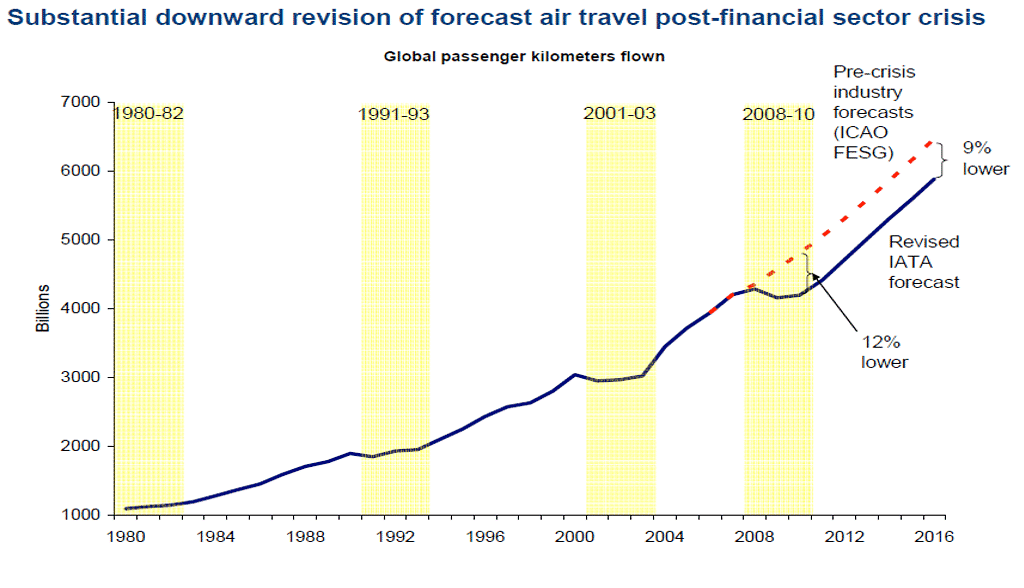
Like most other sectors, aviation, too, rides the waves of economic cycles. The International Air Transport Association (IATA) calculated a one-off drop in passenger volumes of around 12% in 2008, with a 9% structural impact in subsequent years, as shown by Figure 5.
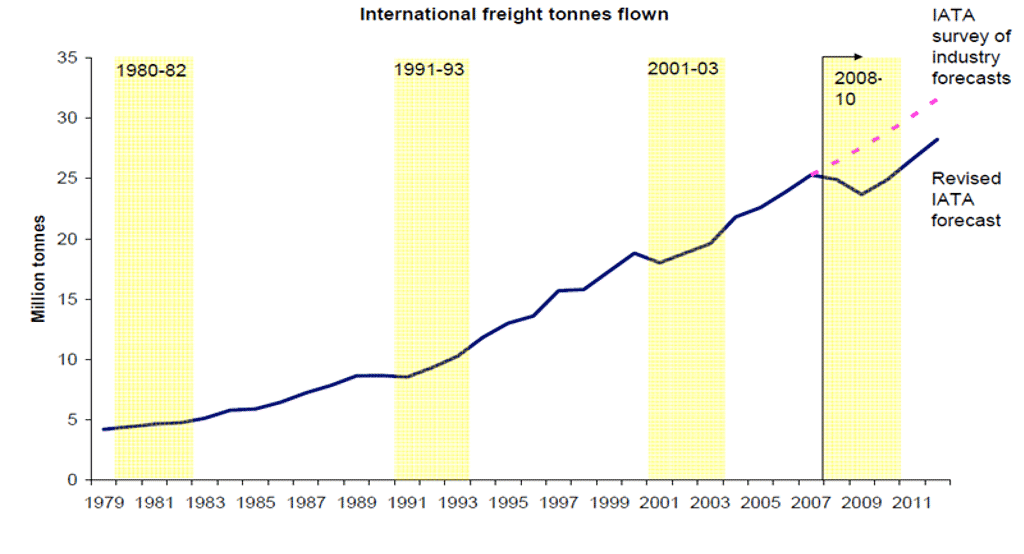
Air cargo also saw a sharp downturn, with a structural impact, as shown by Figure 6.
The Dutch aviation industry is increasingly feeling the global economic impact on aviation as a result of the fact that the Dutch aviation industry, with its small domestic market, is relatively heavily dependent on the rest of the world and, thus, more sensitive to economic cycles outside the Netherlands. For example, in the first quarter of 2009, international passenger services from the Netherlands fell by 10% over previous year. International air cargo transport in the Netherlands dropped sharply by 24% in the same period and the number of air transport movements by more than 12%. Such a decrease in volume had not been seen since World War II.
| Year | Air transport movements at Schiphol | Passenger volume at Schiphol | Air cargo volume at Schiphol (in tonnes) | |||
|---|---|---|---|---|---|---|
| 2000 | 414,927 | 5.42% | 39,270,610 | 7.81% | 1,222,594 | 3.55% |
| 2001 | 416,462 | 0.37% | 39,309,441 | 0.10% | 1,183,208 | -3.22% |
| 2002 | 401,385 | -3.62% | 40,587,562 | 3.25% | 1,239,900 | 4.79% |
| 2003 | 392,996 | -2.09% | 39,808,649 | -1.92% | 1,306,155 | 5.34% |
| 2004 | 402,783 | 2.48% | 42,425,392 | 6.57% | 1,421,115 | 8.80% |
| 2005 | 404,594 | 0.46% | 44,077,539 | 3.89% | 1,449,855 | 2.02% |
| 2006 | 423,122 | 4.58% | 45,988,966 | 4.34% | 1,526,552 | 5.29% |
| 2007 | 435,972 | 3.04% | 47,744,748 | 3.82% | 1,610,282 | 5.48% |
| 2008 | 428,332 | -1.75% | 47,391,711 | -0.74% | 1,567,712 | -2.64% |
| 2009 | 391,265 | -8.65% | 43,523,110 | -8.16% | 1,286,369 | -17.95% |
| 2010 | 386,316 | -1.26% | 45,136,882 | 3.71% | 1,512,251 | 17.56% |
| 2011 | 420,245 | 8.78% | 49,680,625 | 10.07% | 1,523,803 | 0.76% |
| 2012 | 423,405 | 0.75% | 50,975,592 | 2.61% | 1,483,446 | -2.65% |
| 2013 | 425,565 | 0.51% | 52,527,699 | 3.04% | 1,531,086 | 3.21% |
Fluctuations in passenger volume usually affect airport security (passenger screening), passenger services (such as catering, retail and check-in desk services) and government bodies such as the Dutch Immigration and Naturalisation Service and the Dutch Border Police (Royal Netherlands Marechaussee).
Fluctuations in the volume of air cargo usually affect forwarders, air cargo handlers and transport companies (truckers), and the Dutch Tax and Customs Administration.
Employment arising from passenger flows is roughly triple that of employment arising from air cargo. Fluctuations between passenger flows and flows of goods regularly bring about the need for the substantial retraining of employees and their relocation from one segment to another. In order to mitigate the effects of such fluctuations, various airlines have retrained their employees in the past few years, relocating them from air cargo services to other sectors operating in the aviation industry, such as aircraft maintenance. As a result of the crisis, aircraft have in fact been taken in for maintenance at a faster than usual pace.
Table 3 also shows efficiency improvements over the past decade with regard to both the handling of passenger flows and air cargo flows. For example, passenger volume at Schiphol increased by 32.5% between 2002 and 2012 and cargo volume by 20%, although a mere 6.7% additional employees were needed. At the same time, the number of air transport movements has increased by 5.7% in the past decade, which testifies to the emergence of larger aircraft types and improved utilisation rates since 2002.